If you’ve spent any real time on call, you already know that “DevOps” stopped being a job title years ago and became a shared responsibility for shipping software that doesn’t fall over at 2 a.m. Heading into 2026, the gap between teams that deploy confidently dozens of times a day and teams still doing white-knuckle Friday releases has only gotten wider. The difference almost never comes down to talent — it comes down to practices.
This guide walks through the DevOps Best Practices 2026 that we’ve seen actually hold up under production load, across startups shipping their first SOC 2-ready product and enterprises running hundreds of microservices across multiple clouds. We’ll cover CI/CD, infrastructure as code, GitOps, Kubernetes, security, monitoring, logging, cost control, and disaster recovery — with the real mistakes teams make along the way, not the sanitized version you’d get from a vendor slide deck.
Why DevOps Matters More Than Ever in 2026
Three things changed the calculus for engineering leaders going into 2026. First, deployment frequency keeps climbing — teams that used to ship weekly are now shipping multiple times a day because product and AI feature cycles demand it. Second, infrastructure footprints have exploded with the move to GPU-backed workloads, multi-region failover requirements, and hybrid cloud setups that mix AWS, on-prem GPU clusters, and edge nodes. Third, the cost of downtime has gone up sharply — not just in lost revenue, but in regulatory exposure under frameworks like DORA (Digital Operational Resilience Act) for financial services and tightening SOC 2 / ISO 27001 audit expectations.
What used to be “nice to have” — automated pipelines, infrastructure as code, real observability — is now table stakes for raising a Series B, passing an enterprise security review, or simply keeping your SRE team from burning out. Production monitoring in particular has shifted from a reactive dashboard you check after an incident to a proactive system that should be catching 80% of issues before a customer ever notices. The organizations getting this right aren’t necessarily the ones with the biggest engineering budgets — they’re the ones that treated these practices as architecture decisions early, instead of bolting them on after an outage.
Best Practice #1: Build CI/CD Pipelines as Code
Every CI/CD pipeline in your organization should live in version control, right next to the application code it builds and deploys. That sounds obvious in 2026, but we still walk into engagements where half the build jobs were configured by clicking through a Jenkins UI five years ago, and nobody currently employed remembers why a particular post-build step exists.
The fix is straightforward in principle: every pipeline definition — whether it’s a Jenkinsfile, a GitHub Actions workflow, or a GitLab CI YAML file — gets committed alongside the code it builds. Changes to the pipeline go through the same pull request review as application code. This gives you an audit trail, lets you roll back a bad pipeline change as easily as a bad code change, and makes onboarding dramatically faster because new engineers can read the pipeline instead of asking around.
Here’s a trimmed example of a GitHub Actions workflow that we’d consider a reasonable 2026 baseline for a containerized service — build, scan, test, and push to a registry on every merge to main:
name: build-and-push

on:
  push:
    branches: [main]

jobs:
  build:
    runs-on: ubuntu-latest
    permissions:
      contents: read
      packages: write
    steps:
      - uses: actions/checkout@v4

      - name: Build container image
        run: docker build -t ghcr.io/acme/payments-api:${{ github.sha }} .

      - name: Run unit tests
        run: docker run --rm ghcr.io/acme/payments-api:${{ github.sha }} npm test

      - name: Scan image for vulnerabilities
        run: trivy image --exit-code 1 --severity HIGH,CRITICAL ghcr.io/acme/payments-api:${{ github.sha }}

      - name: Push image
        run: |
          echo "${{ secrets.GHCR_TOKEN }}" | docker login ghcr.io -u acme-bot --password-stdin
          docker push ghcr.io/acme/payments-api:${{ github.sha }}
The mistake we see most often here isn’t the absence of a pipeline — almost everyone has one by now. It’s pipeline drift: the production pipeline diverges from what’s in the repo because someone added an “emergency” manual step directly in Jenkins during an incident, and it was never backported into the Jenkinsfile. Six months later, a new hire copies the repo’s Jenkinsfile to set up a second environment, and it’s missing a critical step nobody remembers. Treat your pipeline configuration with the same change discipline as your application code, and this class of bug disappears entirely.
Best Practice #2: Infrastructure as Code with Terraform
By 2026, “we’ll automate the infrastructure later” is one of the most expensive sentences in software. Terraform remains the dominant tool for infrastructure as code across AWS, Azure, and GCP, and Terraform automation is no longer optional for any team running more than a handful of services.
The practice that separates mature teams from the rest isn’t just “using Terraform” — it’s structuring it so changes are reviewable, reusable, and safe. That means: modules for repeatable patterns (a “standard VPC,” a “standard EKS cluster,” a “standard RDS instance with backups enabled”), remote state stored in S3 with DynamoDB locking (or Terraform Cloud), and a CI pipeline that runs terraform plan on every pull request so reviewers can see the actual infrastructure diff before it merges.
module "payments_eks" {
  source  = "git::https://github.com/acme/tf-modules.git//eks?ref=v3.2.0"

  cluster_name    = "payments-prod"
  cluster_version = "1.29"
  vpc_id          = module.network.vpc_id
  subnet_ids      = module.network.private_subnet_ids

  node_groups = {
    default = {
      instance_types = ["m6i.large"]
      min_size       = 3
      max_size       = 12
      desired_size   = 4
    }
  }

  tags = {
    Environment = "production"
    CostCenter  = "payments"
    ManagedBy   = "terraform"
  }
}
The real-world mistake here is console drift. An engineer fixes a security group rule directly in the AWS console during an incident at 11 p.m., it works, the incident closes, and nobody runs terraform plan again for three weeks. When someone finally does, Terraform wants to “fix” that security group back to the old (broken) state, and now you’ve got a confused on-call engineer reverting a hotfix they didn’t know existed. The discipline that prevents this is simple but hard to enforce culturally: any change to managed infrastructure, even an emergency one, gets reflected in code within 24 hours — and your Terraform CI should run a scheduled plan nightly against production to catch drift before it catches you.
Best Practice #3: GitOps for Production Deployments
GitOps workflow adoption has gone from “interesting pattern” to “default expectation” for Kubernetes-based platforms. The core idea is simple: your Git repository is the single source of truth for what should be running in a cluster, and a controller — typically ArgoCD or Flux — continuously reconciles the live cluster state to match what’s declared in Git. Nobody runs kubectl apply against production by hand.
apiVersion: argoproj.io/v1alpha1
kind: Application
metadata:
  name: payments-api
  namespace: argocd
spec:
  project: payments
  source:
    repoURL: https://github.com/acme/payments-deploy.git
    targetRevision: main
    path: overlays/production
  destination:
    server: https://kubernetes.default.svc
    namespace: payments
  syncPolicy:
    automated:
      prune: true
      selfHeal: true
The “selfHeal: true” line is the part that changes team behavior the most. If someone manually edits a Deployment in production — even with good intentions — ArgoCD reverts it back to match Git within minutes. The first time this happens to an engineer, it’s mildly infuriating. The tenth time, it’s the reason your cluster state actually matches your repo, and the reason a postmortem doesn’t include the phrase “we’re not sure why that config was different.”
The most common failure mode we see during GitOps adoption is treating it as “just a deployment tool” without rethinking the promotion workflow. Teams keep a manual “deploy to prod” Jenkins button alongside ArgoCD, and the two systems fight over who owns the cluster. Pick one source of truth, and make every other deployment path read-only or removed entirely.
Best Practice #4: Kubernetes Standardization
Kubernetes DevOps in 2026 isn’t about whether you’re running Kubernetes — almost everyone past a certain scale is. It’s about whether your clusters look the same from team to team, or whether you’ve got fifteen “snowflake” clusters each configured slightly differently by whichever engineer set them up first.
Standardization means: a shared base Helm chart or Kustomize overlay that every service starts from, consistent namespace-per-team or namespace-per-environment conventions, enforced resource requests/limits (so one team’s memory leak doesn’t evict another team’s pods), and Pod Security Standards applied at the namespace level rather than left to individual manifests.
apiVersion: v1
kind: Namespace
metadata:
  name: payments-prod
  labels:
    pod-security.kubernetes.io/enforce: restricted
    pod-security.kubernetes.io/audit: restricted
    team: payments
    cost-center: payments
The mistake that costs the most engineering hours later is letting every team build their own Helm chart from scratch. Eighteen months in, you’ve got forty charts that are 90% identical and 10% subtly different in ways that make a platform-wide change — like rolling out a new sidecar for mesh-based mTLS — take three months instead of three days. A small platform team investing in a “golden path” chart that 80% of services can use unmodified pays for itself the first time you need to roll out a cluster-wide change.
Best Practice #5: Security Shift Left
Security shift left means moving security checks earlier in the pipeline — into the pull request, not the post-deployment audit. By 2026, this is no longer optional for any company selling into enterprise customers, who will ask for your SBOM (Software Bill of Materials) and container scan results as part of procurement.
In practice, this means: SAST scanning on every PR (Semgrep, CodeQL), dependency vulnerability scanning (Dependabot, Snyk), container image scanning before push (Trivy, Grype), secrets scanning to catch committed credentials before merge, and policy-as-code guardrails (OPA/Gatekeeper or Kyverno) that reject manifests violating baseline security rules — like containers running as root or images pulled from unapproved registries.
apiVersion: kyverno.io/v1
kind: ClusterPolicy
metadata:
  name: disallow-root-containers
spec:
  validationFailureAction: Enforce
  rules:
    - name: check-runAsNonRoot
      match:
        resources:
          kinds:
            - Pod
      validate:
        message: "Containers must not run as root"
        pattern:
          spec:
            securityContext:
              runAsNonRoot: true
The recurring mistake is treating secrets management as a one-time setup task. Teams move secrets into Vault or AWS Secrets Manager during initial setup, feel good about it, and then six months later a new microservice ships with an API key hardcoded in a ConfigMap because “it was faster” and the secrets scanner wasn’t wired into that repo’s pipeline yet. Security shift left only works if every new repository inherits the same baseline checks automatically — through a shared pipeline template, not a wiki page someone forgets to read.
Best Practice #6: Automated Testing Strategy
A CI/CD pipeline that deploys broken code faster is not progress. The testing strategies that hold up in production combine a healthy test pyramid — lots of fast unit tests, a reasonable layer of integration tests, and a thin layer of end-to-end tests — with deployment-time safety nets: automated smoke tests immediately after deploy, and canary or progressive delivery so a bad release affects 5% of traffic, not 100%.
Contract testing (using a tool like Pact) deserves more attention than it gets. In a microservices environment, the most common production incident isn’t “the new code has a bug” — it’s “service A changed its API response shape in a way that broke service B, and nobody on either team knew until production.” Contract tests catch this in CI, before either team deploys.
The mistake we see constantly: teams write extensive tests for the “happy path” during initial development, then stop maintaining test coverage as the codebase grows, because “we’ll get back to it.” Eighteen months later, the test suite takes 45 minutes to run, is 60% flaky, and engineers routinely merge with --no-verify because waiting for CI is slower than just shipping and watching the dashboards. At that point, your test suite isn’t providing safety — it’s providing false confidence while actively training your team to bypass it.
Best Practice #7: Observability and Monitoring
Production monitoring in 2026 means more than uptime checks and CPU graphs. The teams with the fastest mean-time-to-resolution have invested in the three pillars of observability — metrics, logs, and traces — tied together with OpenTelemetry instrumentation, visualized in Grafana, with Prometheus (or a managed equivalent like Amazon Managed Prometheus) as the metrics backend.
The key shift from “monitoring” to “observability” is the ability to answer questions you didn’t anticipate when you set up the dashboard. A CPU graph tells you the database is under load. A trace tells you it’s under load because a specific endpoint started making N+1 queries after yesterday’s deploy. That second answer is the one that gets an incident resolved in 12 minutes instead of 90.
groups:
  - name: payments-api-slo
    rules:
      - alert: HighErrorRateBudgetBurn
        expr: |
          sum(rate(http_requests_total{job="payments-api", status=~"5.."}[5m]))
          /
          sum(rate(http_requests_total{job="payments-api"}[5m]))
          > 0.02
        for: 10m
        labels:
          severity: page
        annotations:
          summary: "Payments API error rate above 2% SLO budget"
The most damaging mistake in this category is alert fatigue from un-tuned thresholds. A team sets up Prometheus, copies a generic alerting ruleset from a blog post, and within a week the on-call engineer is getting paged eight times a night for things that auto-resolve in 90 seconds. After a month of this, pages get muted, snoozed, or routed to a channel nobody watches — and the one alert that actually mattered gets lost in the noise. Define SLOs first (what error rate and latency actually matters to your users), then build alerts around error budget burn rate, not raw thresholds.
Best Practice #8: Centralized Logging
In a containerized, autoscaling environment, logs written to local disk are logs that will disappear the moment a pod is rescheduled — which, on a busy cluster, can be every few minutes. Centralized logging via Loki, the ELK/OpenSearch stack, or a managed service like Datadog Logs isn’t a “nice to have” observability add-on; it’s the only way incident responders can reconstruct what happened across dozens of ephemeral containers.
The practice that makes centralized logging actually useful is structured logging with correlation IDs. Every log line should be JSON, include a trace ID that ties it to the corresponding distributed trace, and include consistent fields (service name, environment, version) so you can filter across the entire fleet during an incident rather than grepping through one pod’s logs at a time.
The common failure here is logging too much, unstructured, with no retention strategy — until the logging bill exceeds the compute bill, at which point someone disables debug logging fleet-wide right before it’s needed for an incident. Tiered retention (hot storage for 7 days, cold storage for 90) combined with sampling on high-volume, low-value log lines (like health check requests) keeps both the bill and the signal-to-noise ratio under control.
Best Practice #9: Cost Optimization in Cloud Infrastructure
Cost optimization is now squarely a DevOps automation problem, not a once-a-quarter finance exercise. The teams getting this right bake cost awareness directly into the deployment pipeline: every Terraform module is tagged for cost allocation by default, autoscaling policies are tuned against real traffic patterns rather than worst-case guesses, and tools like Karpenter handle node provisioning with spot instances for stateless, fault-tolerant workloads.
One enterprise client we worked with cut their EKS compute spend by roughly 38% over two quarters without any user-facing changes — just by combining Karpenter-based spot provisioning for CI runners and background jobs, rightsizing over-provisioned node groups based on six weeks of actual utilization data, and adding a weekly automated report that flags any namespace whose requested resources exceed actual usage by more than 50%.
The mistake that keeps cloud bills high is structural: nobody owns the bill. Engineering owns the architecture, finance owns the invoice, and the feedback loop between “this design decision will cost $40,000/month” and the engineer who made that decision can be six months long. Tagging resources by team and surfacing per-team cost dashboards directly in the tools engineers already use — Slack, Grafana, or the PR itself via a cost-diff bot on Terraform plans — closes that loop.
Best Practice #10: Disaster Recovery and Backup Automation
Backups that have never been restored are not backups — they’re an assumption. Disaster recovery automation in 2026 means automated, encrypted backups for every stateful system (databases, object storage, persistent volumes), and a scheduled, automated restore-and-verify job that proves those backups actually work.
For Kubernetes-based platforms, tools like Velero handle scheduled cluster and persistent volume backups, while database-level point-in-time recovery (PITR) should be enabled and tested for any RDS, Aurora, or self-managed Postgres instance holding production data. Beyond backups, mature teams run quarterly failover drills — actually failing over to a secondary region, not just reviewing a runbook on a whiteboard — because the gap between “the runbook says this works” and “this works” is exactly where outages turn into multi-day incidents.
The mistake that turns a bad day into a catastrophic one: discovering during an actual incident that the backup job has been silently failing for three months because a credential rotated and nobody updated the backup service account. A backup pipeline needs its own monitoring and alerting — a successful backup that nobody verified is indistinguishable from no backup at all until the moment you need it.
Real Enterprise DevOps Workflow Example
To make this concrete, here’s how these practices come together at a mid-sized fintech company — we’ll call them NorthBridge Payments, a composite of patterns we’ve seen across several real engagements processing several million transactions a day.
An engineer opens a pull request against the payments-api repository. GitHub Actions immediately runs unit tests, SAST scanning, and a Terraform plan for any infrastructure changes — the plan output is posted as a PR comment so reviewers see exactly what will change in AWS before approving. Once two engineers approve and CI passes, the merge to main triggers a build: the container image is built, scanned with Trivy (the pipeline fails the build on any HIGH or CRITICAL CVE without an approved exception), signed with cosign, and pushed to ECR.
A separate payments-deploy repository holds the Kustomize overlays for staging and production. The CI pipeline opens an automated PR bumping the image tag in the staging overlay. ArgoCD picks up the merge and syncs staging within two minutes. Automated smoke tests run against staging; if they pass, a second automated PR is opened for the production overlay — but this one requires manual approval from the on-call lead, enforced via a GitHub environment protection rule.
On approval, ArgoCD syncs production using a progressive rollout (Argo Rollouts), shifting traffic from 5% to 25% to 100% over 20 minutes, with automated rollback if the error-rate SLO defined in Prometheus breaches its threshold during the rollout. Throughout, Grafana dashboards display the rollout’s impact on latency and error rate in real time on the team’s shared monitor, and structured logs flow into Loki with the new version’s correlation IDs tagged for easy filtering.
If anything goes wrong, Argo Rollouts automatically reverts to the previous ReplicaSet, ArgoCD’s self-heal keeps the cluster aligned with the last-known-good Git state, and an incident channel is auto-created with links to the relevant dashboards, the diff that triggered the rollback, and the on-call runbook. Total time from “bad deploy detected” to “traffic fully reverted”: under three minutes, with no human needing to type a single kubectl command.
Common DevOps Mistakes Companies Make
Across dozens of engagements, the same handful of mistakes show up again and again — almost never due to lack of skill, almost always due to lack of time or organizational pressure to “just ship it”:
- Configuring CI/CD pipelines through a UI instead of code — leading to pipeline drift that nobody can explain six months later.
- Manual changes to cloud infrastructure during incidents that never get reflected back into Terraform, causing dangerous drift.
- Treating Kubernetes clusters as snowflakes — every team configures their own namespace, charts, and security settings slightly differently.
- Adding security scanning only to “important” repos, leaving new services unprotected until an audit finds them.
- Letting test suites rot until they’re slow and flaky enough that engineers route around them with
--no-verify. - Copying generic alerting rules without tuning thresholds, leading to alert fatigue and muted pages.
- Logging without structure or retention strategy, until the logging bill rivals the compute bill.
- Nobody owns the cloud bill, so cost-impacting architecture decisions get made with no cost feedback loop.
- Backups that are never restore-tested, discovered to be broken only during a real incident.
- Running GitOps and a manual deploy button side by side, leaving two systems fighting over who owns production state.
Tools We Recommend in 2026
None of these practices require an exotic toolchain — most of the value comes from how consistently a relatively standard set of tools is applied across an organization. Here’s the core stack we keep coming back to:
Git — the source of truth for everything: application code, pipeline definitions, Terraform modules, and Kubernetes manifests.
GitHub Actions — for build, test, scan, and image publishing pipelines, with reusable workflow templates shared across repositories.
Jenkins — still widely used in enterprises with complex, long-running build pipelines and on-prem integration requirements; Jenkinsfiles checked into the same repo as the code they build.
Docker — the packaging format for everything that gets deployed, built once and promoted across environments without rebuilding.
Kubernetes — the standard runtime for production workloads, with standardized base charts and namespace policies across teams.
Terraform — infrastructure as code across cloud providers, with remote state, modules, and PR-based plan review.
AWS — the underlying cloud platform for the majority of enterprise workloads we see, with EKS, RDS, and S3 forming the backbone of most stacks.
Prometheus — metrics collection and alerting, with SLO-based alert rules rather than raw thresholds.
Grafana — dashboards and visualization across metrics, logs, and traces in one pane of glass.
Linux — the operating system underpinning virtually every node, container, and CI runner in the stack.
Future of DevOps Beyond 2026
A few trends are already reshaping what “best practice” will mean over the next few years. Platform engineering continues to formalize — instead of every product team owning their own CI/CD and Kubernetes configuration, a dedicated platform team builds an internal developer platform (IDP) with self-service “golden paths,” so product engineers get a working pipeline, cluster namespace, and monitoring setup the moment they create a new service, without needing deep infrastructure expertise.
AI-assisted operations (AIOps) is moving past anomaly-detection dashboards into genuinely useful territory: tools that can correlate a spike in error rate with the specific deploy, config change, or dependency update that caused it, and suggest (or in constrained cases, automatically execute) a rollback. The teams adopting this successfully are pairing it with strong observability foundations — AI correlation is only as good as the telemetry it has to work with.
eBPF-based observability (via tools like Cilium and Pixie) is reducing the instrumentation burden for distributed tracing, capturing network and syscall-level data without requiring every service to be manually instrumented. And policy-as-code is expanding beyond Kubernetes admission control into cost policies, data residency policies, and AI model usage policies — all enforced automatically in the same pipelines that already gate security and infrastructure changes.
Conclusion
None of the ten practices above are individually revolutionary — CI/CD as code, Terraform, GitOps, Kubernetes standardization, shift-left security, automated testing, observability, centralized logging, cost optimization, and disaster recovery automation have all existed in some form for years. What separates high-performing teams in 2026 isn’t knowing about these practices — it’s the consistency of applying them across every team, every repository, and every environment, and the discipline to fix the gaps before an incident finds them first.
If you’re auditing your own stack against this list, the honest exercise is picking the one practice where you know you have the biggest gap — usually it’s either drift between infrastructure code and reality, or an observability setup that can tell you that something is wrong but not why — and fixing that one thing before adding anything new.
Need Help Implementing These Practices?
Auditing and rebuilding a CI/CD pipeline, migrating to GitOps, or standardizing a sprawling Kubernetes footprint is exactly the kind of work that benefits from a second set of experienced eyes. Softwarestech’s DevOps consulting services work with engineering teams — from early-stage startups to enterprise platform teams — to build CI/CD pipelines as code, implement Terraform automation, set up GitOps workflows with ArgoCD, and stand up production monitoring that actually catches issues before customers do. If your team is evaluating where to start, reach out and we’ll help you map your current setup against the practices in this guide and prioritize the highest-impact fixes first.
FAQ
What are the most important DevOps best practices for 2026?
The highest-leverage practices are CI/CD pipelines defined as code, infrastructure as code with Terraform, GitOps-based deployments, and real production monitoring built around SLOs. These four form the foundation that every other practice — security, cost optimization, disaster recovery — builds on.
How is GitOps different from traditional CI/CD deployments?
Traditional CI/CD typically “pushes” changes to an environment as the final pipeline step. GitOps flips this around: a controller like ArgoCD continuously “pulls” the desired state from Git and reconciles the live cluster to match it, automatically reverting any manual changes that drift from what’s declared in the repository.
Do small startups need Kubernetes, or is it overkill?
Not always. If you’re running a handful of services on a couple of instances, a simpler platform (ECS, App Runner, or a PaaS) is often the right call. Kubernetes earns its complexity once you’re managing many services across multiple environments and need consistent scaling, deployment, and security patterns — usually somewhere past 10-15 services or when multi-region requirements appear.
What’s the biggest mistake companies make when adopting DevOps?
Treating DevOps practices as tools to install rather than habits to enforce consistently. A team can have Terraform, ArgoCD, and Prometheus all running and still suffer from drift, alert fatigue, and untested backups if these tools aren’t paired with consistent processes — like requiring infrastructure changes to go through code review, or tuning alerts against real SLOs.
How much does it cost to set up a production-grade CI/CD pipeline?
The tooling itself (GitHub Actions, Jenkins, ArgoCD) is largely free or low-cost at moderate scale. The real cost is engineering time — typically a few weeks for a small team to get a solid pipeline with testing, scanning, and progressive deployment in place, longer for organizations standardizing across many existing repositories.
What’s the difference between monitoring and observability?
Monitoring tells you that something is wrong — CPU is high, error rate spiked. Observability gives you the ability to ask why, by correlating metrics, logs, and traces so you can trace a symptom back to its root cause without needing to have predicted that specific failure mode in advance.
Is Terraform still the best IaC tool in 2026?
Terraform remains the most widely adopted infrastructure as code tool across multi-cloud environments, with the largest module ecosystem and broadest provider support. Pulumi and OpenTofu (the Terraform fork) are credible alternatives depending on language preferences and licensing considerations, but Terraform’s patterns — modules, state, plan/apply — remain the dominant mental model.
How long does it take to migrate from Jenkins to GitHub Actions?
For a single repository with a moderately complex Jenkinsfile, migration usually takes a few days to a couple of weeks, including testing the new pipeline in parallel before cutting over. Organization-wide migrations take much longer — not because of the YAML conversion itself, but because of custom Jenkins plugins, shared libraries, and on-prem integrations that need equivalent solutions in the new platform.
What DevOps trends should engineering leaders watch in 2026?
Platform engineering and internal developer platforms, AI-assisted incident correlation and remediation, eBPF-based observability that reduces instrumentation overhead, and policy-as-code expanding beyond security into cost and compliance enforcement are the trends most likely to affect how teams operate over the next few years.
How can DevOps consulting services help our team?
An experienced DevOps consulting partner can shortcut months of trial and error — auditing your current pipelines and infrastructure for drift and security gaps, implementing GitOps and Terraform automation correctly the first time, and setting up production monitoring tied to real SLOs. This is especially valuable when an internal team is focused on product delivery and doesn’t have bandwidth to dedicate to platform work, or when standardizing practices across multiple teams that have grown organically in different directions.
Further Reading
- DevOps Best Practices 2026: Platform Engineering
- Kubernetes in Production at Enterprise Scale
- Modern SDLC Guide 2026
For industry benchmarks and additional context, we recommend the DORA State of DevOps Research.
Need Help Building Your Next Digital Product?
From web and mobile apps to cloud infrastructure and AI-powered platforms — our engineers can help you plan, build and scale with confidence.
Related Articles
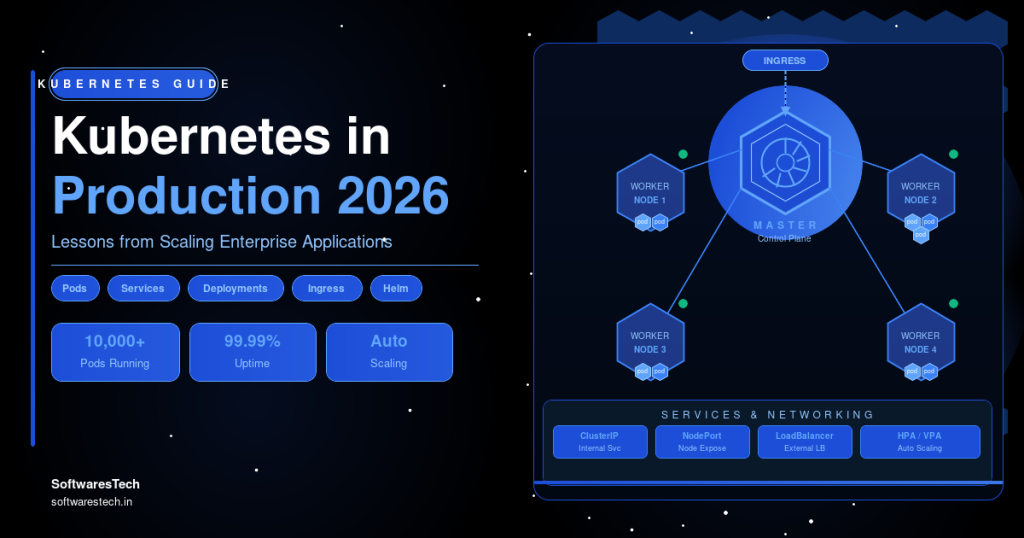
Kubernetes in Production: Lessons Learned from Scaling Enterprise Applications
The first time you run kubectl get pods against a production cluster that's serving real customer traffic, something shifts. The conference talks, the "getting...
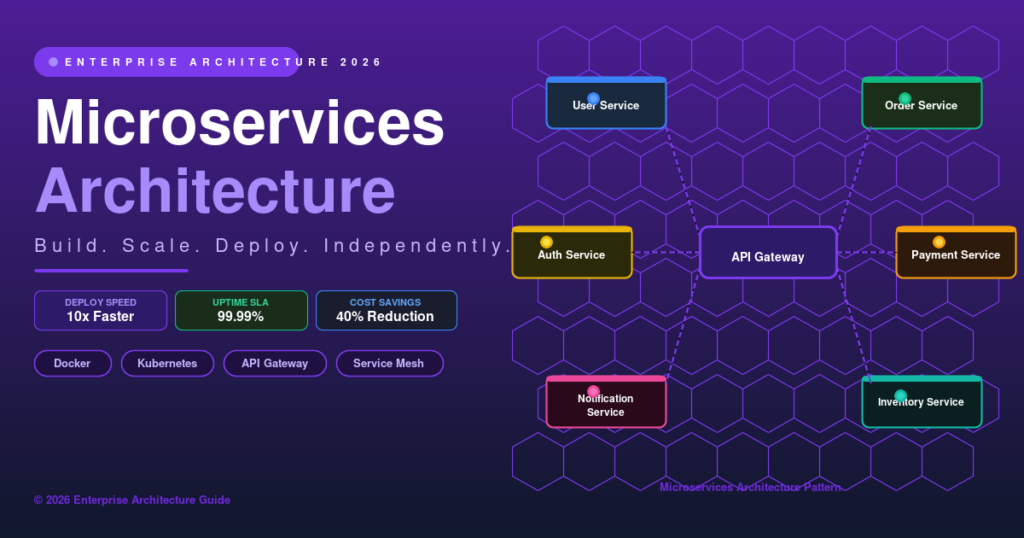
Microservices Architecture: The Complete Engineering Guide for 2026
A complete, practical guide to microservices architecture — covering service communication, data management, security, Kubernetes deployment, observability and real-world migration patterns for 2026.
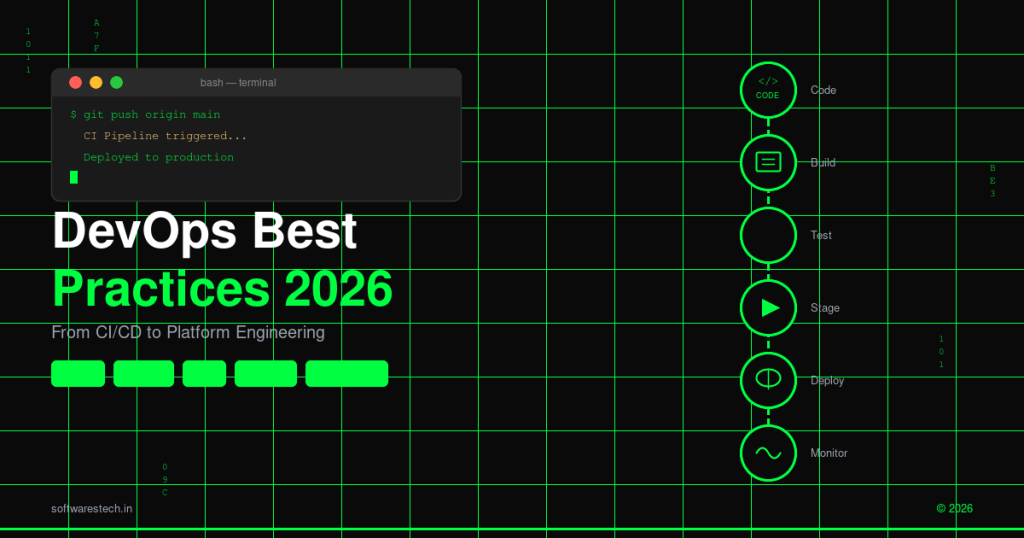
DevOps Best Practices in 2026: From CI/CD to Platform Engineering
A practical guide to DevOps best practices in 2026, covering platform engineering, GitOps, Kubernetes, observability, DevSecOps, and AIOps with real client examples.